

Sparklines are small graphs, typically embedded in text, that summarize a time series or similar information. The jquery.sparklines plugin provides for several different chart styles and a useful variety of display options. You can combine the sparklines plugin with the jquery.timers plugin to display data that's changing in real time. This slice shows one way to accomplish that.
How it works
This example assumes that you can use a single JSON query to get the data for all the sparklines at once and that you know at the time the view is rendered how many graphs are to be displayed. The trick is choosing a suitable scheme for generating graph ids, in this case ["dynbar0", "dynbar1", ....], and using the same id strings as keys for the dictionary returned from the JSON service function. This makes it simple to use the web2py view templating methods to generate jquery.sparkline() calls that update the sparklines with data returned from the service function.
What this slice does
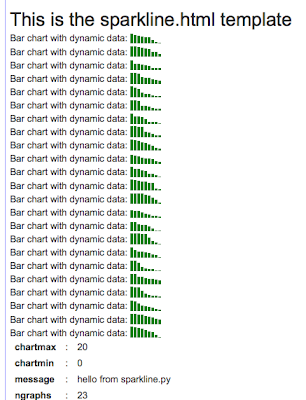
When you browse to the index page, it puts up between 5 and 25 bar graphs with random values reverse sorted to emulate Pareto charts. The charts update once per second with new data from the server.
(WARNING - a few minutes of this drives my MacBook's cpu usage up because I don't have indexing turned off for wherever the json data is going and/or wherever the web2py server is storing temporary files.)
Screen Shot
Here's the code.
1. web2py_ajax.html - add the sparkline and timer plugins
response.files.insert(4,URL(r=request,c='static',f='jquery.sparkline.js'))
response.files.insert(5,URL(r=request,c='static',f='jquery.timers-1.2.js'))
2. The controller
import sys
import random
def index():
    ngraphs = random.choice(range(5,25))
    return dict(message="hello from sparkline.py", ngraphs=ngraphs, chartmin=0, chartmax=20)

def call():
    session.forget()
    return service()

@service.json
def sparkdata(ngraphs,chartmin,chartmax):
    ngraphs = int(ngraphs)
    chartmin = int(chartmin)
    chartmax = int(chartmax)
    #sys.stderr.write("\nsparkdata() called with ngraphs=%d\n"%ngraphs)
    d = dict()
    for n in xrange(ngraphs):
        id = "dynbar" + str(n)
        ## data for bar graph.
        ## 9 random ints between chartmax and chartmin
        data = [random.choice(range(chartmin,chartmax)) for i in xrange(9)]
        ## simulate a Pareto plot
        data.sort()
        data.reverse()
        d[id] = data
        #sys.stderr.write("\n%s : %s"%(id, str(d[id])))
    return d
3. The view (index.html)
{{extend 'layout.html'}}
{{
chartoptions = "{type: 'bar', barColor: 'green', 'chartRangeMin': '%d',
                        'chartRangeMax': '%d'}"%(chartmin,chartmax)
jsonurl = URL(r=request,f='call/json/sparkdata/%(ngraphs)d/%
                        (chartmin)d/%(chartmax)d'%locals())
}}

<script type="text/javascript">
    /* <![CDATA[ */
    $(function() {
        $(this).everyTime(1000,function(i) {
            $.getJSON('{{=jsonurl}}', function(data) {
            {{for n in xrange(ngraphs):}}
                $("#dynbar{{=n}}").sparkline(data.dynbar{{=n}}, {{=chartoptions}});
                {{pass}}
            });
        });
    });
    /* ]]> */
</script>
<h1>This is the sparkline.html template</h1>
{{for n in xrange(ngraphs):}}
<p>
Bar chart with dynamic data: <span id="dynbar{{=n}}" class="dynamicbar">Loading..</span>
</p>
{{pass}}
{{=BEAUTIFY(response._vars)}}
That's it! Sparkline charts are really useful in applications where you need to visually compare lots of similar data series. Here's a link to a chapter in Edward Tufte's "Beautiful Evidence" with more info
http://www.edwardtufte.com/bboard/q-and-a-fetch-msg?msg_id=0001OR
The JQuery Sparklines plug-in page is also useful.


Comments (2)
0
hillmanov 14 years ago
0
hillmanov 14 years ago