Implementing Web2Py+Pygal 2.0.
This recipe shows how to create beautiful charts with the help of pygal, an open source SVG charting.
Why pygal (http://pygal.org/)?
Pygal is a dynamic SVG charting library, It features various graph types:
Bar charts, Line charts, XY charts, Pie charts, Radar charts, Dot charts, Pyramid charts, Funnel charts and Gauge charts.
And much more... Do you can create your own custom Python/Css styling or use the packaged themes (default, light, neon, clean, dark_solarized, light_solarized)
...And a lot of options to customize the charts.
Installing pygal
easy_install pygal
IMPORTANT: If you have an old pygal version, please Upgrade it:
pip install pygal --upgrade
Controller (defaul.py)
def index():
    plot_pygal= URL('default', 'plot_pygal')
    return dict(plot_pygal=plot_pygal)


def plot_pygal():
    #Please serve pygal-tooltips.min.js from your local server: http://kozea.github.com/pygal.js/latest/pygal-tooltips.min.js
    response.files.append(URL('default','static/js/pygal-tooltips.min.js'))
    response.headers['Content-Type']='image/svg+xml'
    import pygal
    from pygal.style import CleanStyle
    bar_chart = pygal.Bar(style=CleanStyle)                            # Then create a bar graph object
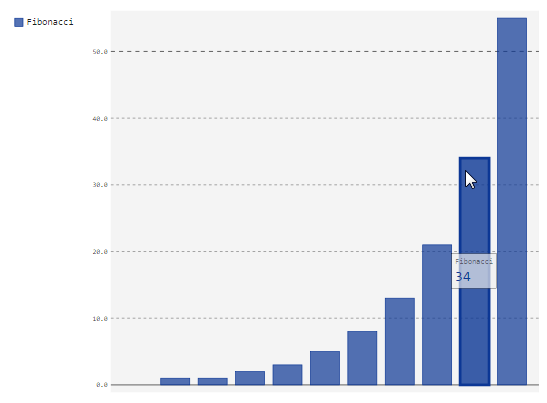
    bar_chart.add('Fibonacci', [0, 1, 1, 2, 3, 5, 8, 13, 21, 34, 55])  # Add some values
    return bar_chart.render()
View (index.html)
<figure>
  <embed type="image/svg+xml" src="{{=plot_pygal}}" />
</figure>
Results

UPDATE
Creating impressive charts customizing the styles
IMPORTANT: If you have an old pygal version, please Upgrade it:
pip install pygal --upgrade
Controller (default.py)
def index():
    chart = URL('default', 'chart')
    return dict(chart=chart)

# See the Doc's for more info and options of customize: http://www.pygal.org/en/latest/documentation/custom_styles.html
def chart():
    #Please serve this file locally, download at: http://kozea.github.com/pygal.js/latest/pygal-tooltips.min.js
    response.files.append(URL('default','static/js/pygal-tooltips.min.js'))
    response.headers['Content-Type']='image/svg+xml'
    import pygal
    from pygal.style import Style

    custom_style = Style(
        background='transparent',
        plot_background='transparent',
        foreground='#53E89B',
        foreground_strong='#53A0E8',
        foreground_subtle='#630C0D',
        opacity='.6',
        opacity_hover='.9',
        transition='400ms ease-in',
        colors=('#E853A0', '#E8537A', '#E95355', '#E87653', '#E89B53')
        )

    chart = pygal.StackedLine(fill=True, interpolate='cubic', style=custom_style, )
    chart.add('A', [1, 3,  5, 16, 13, 3,  7])
    chart.add('B', [5, 2,  3,  2,  5, 7, 17])
    chart.add('C', [6, 10, 9,  7,  3, 1,  0])
    chart.add('D', [2,  3, 5,  9, 12, 9,  5])
    chart.add('E', [7,  4, 2,  1,  2, 10, 0])
    chart.render()
    return chart.render()
View (index.html)
{{extend 'layout.html'}}

<h1>Scale 30%</h1>
<figure>
  <embed style='width:30%;' class='img-responsive col-xs-12' type="image/svg+xml" src="{{=chart}}" />
</figure>

<h1>Scale 50%</h1>
<figure>
  <embed style='width:50%;' class='img-responsive col-xs-12' type="image/svg+xml" src="{{=chart}}" />
</figure>

<h1>Scale 100%</h1>
<figure>
  <embed type="image/svg+xml" src="{{=chart}}" />
</figure>


Comments (12)
- Login to post
order by: newest oldest upvoted downvoted
- write2ariya 10 years ago
<script type="text/javascript" src="http://kozea.github.com/pygal.js/javascripts/svg.jquery.js"></script>
<script type="text/javascript" src="http://kozea.github.com/pygal.js/javascripts/pygal-tooltips.js"></script>
for you view for hover effect tooltip
- write2ariya 10 years ago
show more comments0
ranjan 11 years ago
it works fine, but the hover effect is not working as demonstrated in
http://pygal.org/first_steps/
replies (1)
0
write2ariya 10 years ago
hi ranjan
You have to include
0
jocla123k 10 years ago
Hi write2ariya
You have managed to place these graphics in html?
Embedding in a web page?
replies (1)
0
jocla123k 10 years ago
write2ariya can u help me?
0
abraindump 10 years ago
[Hover Effect Part 2]
Then using the example controller code from the slice you must specify where the JS files are. See the references to Config below. Create the Config object, set the JS locations then pass the Config to the chart.
def plot_pygal():
    response.headers['Content-Type']='image/svg+xml'
    Config = pygal.Config()
    Config.js = ['https://<IP>:8000/<appname>/static/js/svg.jquery.js',
                 'https://<IP>:8000/<appname>/static/js/pygal-tooltips.js']
    bar_chart = pygal.Bar(Config, style=CleanStyle)      # Then create a bar graph object
    bar_chart.add('Fibonacci', [0, 1, 1, 2, 3, 5, 8, 13, 21, 34, 55])  # Add some values       return bar_chart.render()
Now when you display the chart hovering over any bar will display the value.