
Implementing Web2Py+Pygal 2.0.
This recipe shows how to create beautiful charts with the help of pygal, an open source SVG charting.
Why pygal (http://pygal.org/)?
Pygal is a dynamic SVG charting library, It features various graph types:
Bar charts, Line charts, XY charts, Pie charts, Radar charts, Dot charts, Pyramid charts, Funnel charts and Gauge charts.
And much more... Do you can create your own custom Python/Css styling or use the packaged themes (default, light, neon, clean, dark_solarized, light_solarized)
...And a lot of options to customize the charts.
Installing pygal
easy_install pygal
IMPORTANT: If you have an old pygal version, please Upgrade it:
pip install pygal --upgrade
Controller (defaul.py)
def index():
plot_pygal= URL('default', 'plot_pygal')
return dict(plot_pygal=plot_pygal)
def plot_pygal():
#Please serve pygal-tooltips.min.js from your local server: http://kozea.github.com/pygal.js/latest/pygal-tooltips.min.js
response.files.append(URL('default','static/js/pygal-tooltips.min.js'))
response.headers['Content-Type']='image/svg+xml'
import pygal
from pygal.style import CleanStyle
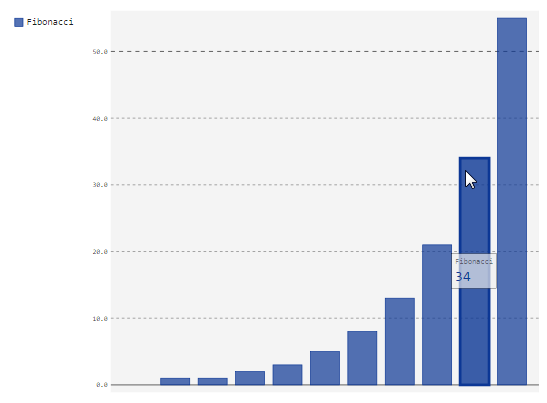
bar_chart = pygal.Bar(style=CleanStyle) # Then create a bar graph object
bar_chart.add('Fibonacci', [0, 1, 1, 2, 3, 5, 8, 13, 21, 34, 55]) # Add some values
return bar_chart.render()
View (index.html)
<figure>
  <embed type="image/svg+xml" src="{{=plot_pygal}}" />
</figure>
Results
UPDATE
Creating impressive charts customizing the styles
IMPORTANT: If you have an old pygal version, please Upgrade it:
pip install pygal --upgrade
Controller (default.py)
def index():
    chart = URL('default', 'chart')
    return dict(chart=chart)

# See the Doc's for more info and options of customize: http://www.pygal.org/en/latest/documentation/custom_styles.html
def chart():
    #Please serve this file locally, download at: http://kozea.github.com/pygal.js/latest/pygal-tooltips.min.js
    response.files.append(URL('default','static/js/pygal-tooltips.min.js'))
    response.headers['Content-Type']='image/svg+xml'
    import pygal
    from pygal.style import Style

    custom_style = Style(
        background='transparent',
        plot_background='transparent',
        foreground='#53E89B',
        foreground_strong='#53A0E8',
        foreground_subtle='#630C0D',
        opacity='.6',
        opacity_hover='.9',
        transition='400ms ease-in',
        colors=('#E853A0', '#E8537A', '#E95355', '#E87653', '#E89B53')
        )

    chart = pygal.StackedLine(fill=True, interpolate='cubic', style=custom_style, )
    chart.add('A', [1, 3,  5, 16, 13, 3,  7])
    chart.add('B', [5, 2,  3,  2,  5, 7, 17])
    chart.add('C', [6, 10, 9,  7,  3, 1,  0])
    chart.add('D', [2,  3, 5,  9, 12, 9,  5])
    chart.add('E', [7,  4, 2,  1,  2, 10, 0])
    chart.render()
    return chart.render()
View (index.html)
{{extend 'layout.html'}}

<h1>Scale 30%</h1>
<figure>
  <embed style='width:30%;' class='img-responsive col-xs-12' type="image/svg+xml" src="{{=chart}}" />
</figure>

<h1>Scale 50%</h1>
<figure>
  <embed style='width:50%;' class='img-responsive col-xs-12' type="image/svg+xml" src="{{=chart}}" />
</figure>

<h1>Scale 100%</h1>
<figure>
  <embed type="image/svg+xml" src="{{=chart}}" />
</figure>


Comments (12)
- Login to post
order by: newest oldest upvoted downvoted
pygal hover fix! Add files to web2py app/static/js folder
http://kozea.github.com/pygal.js/javascripts/svg.jquery.js
http://kozea.github.com/pygal.js/javascripts/pygal-tooltips.js
chmod web2py. browse to them. See ref to Config
pygal hover fix! Add files to web2py app/static/js folder
http://kozea.github.com/pygal.js/javascripts/svg.jquery.js
http://kozea.github.com/pygal.js/javascripts/pygal-tooltips.js
chmod web2py. browse to them. See ref to Config
show more comments0
sif-baksh-10957 9 years ago
More
my controller:
import pygal

def pie():
    response.headers['Content-Type']='image/svg+xml'
    pie_chart = pygal.Pie(width=400)
    pie_chart.title = 'Browser usage in February 2012 (in %)'
    pie_chart.add('IE', 39.5)
    pie_chart.add('Firefox', 26.6)
    pie_chart.add('Chrome', 26.3)
    pie_chart.add('Safari', 4.5)
    pie_chart.add('Opera', 2.3)
    return pie_chart.render()
What am I doing wrong?
0
sif-baksh-10957 9 years ago
Question trying to get this to work my self
pie.html
<script type="text/javascript" src="http://kozea.github.com/pygal.js/javascripts/svg.jquery.js"></script>
<script type="text/javascript" src="http://kozea.github.com/pygal.js/javascripts/pygal-tooltips.js"></script>
{{extend 'layout.html'}}
<h1>This is the examples/pie.html template</h1>

<embed src="{{=URL(pie)}}" type="image/svg+xml" />
0
abraindump 10 years ago
def plot_pygal():
    response.headers['Content-Type']='image/svg+xml'
    Config = pygal.Config()
    Config.js = ["https://<IP>:8000/<app>/static/js/svg.jquery.js",
                 "https://<IP>:8000/<app>/static/js/pygal-tooltips.js"]
    bar_chart = pygal.Bar(Config, style=CleanStyle)
    bar_chart.add('Fibonacci', [0, 1, 1, 2, 3, 5, 8, 13, 21, 34, 55])
    return bar_chart.render()
0
abraindump 10 years ago
Hover Fix. Save 2 files in web2py app/static/js folder.
http://kozea.github.com/pygal.js/javascripts/svg.jquery.js
http://kozea.github.com/pygal.js/javascripts/pygal-tooltips.js
chown web2py. Test them from your browser. See all references to Config.
def plot_pygal():
    response.headers['Content-Type']='image/svg+xml'
    Config = pygal.Config()
    Config.js = ['https://<IP>:8000/<appname>/static/js/svg.jquery.js',
                 'https://<IP>:8000/<appname>/static/js/pygal-tooltips.js']
    bar_chart = pygal.Bar(Config, style=CleanStyle)    # Then create a bar graph object
    bar_chart.add('Fibonacci', [0, 1, 1, 2, 3, 5, 8, 13, 21, 34, 55]) # Add some values
    return bar_chart.render()